 NA-MIC Project Weeks
Back to Projects List
DICOM Meta-Dashboard
Key Investigators
- Hans Meine (Fraunhofer MEVIS, Germany)
- Stefan Denner (German Cancer Research Center, Germany)
- Klaus Kades (German Cancer Research Center, Germany)
- Marco Nolden (German Cancer Research Center, Germany)
- Andrey Fedorov (BWH)
Project channel on Discord: #dicom-meta-dashboard
Project Description
In practice, importing DICOM files into workspaces (e.g., for reader studies, analyses, …) requires some manual filtering, sorting, and selection.
- sorting out “scout” images (localizers)
- sorting out images with artifacts, the acquisition of which was repeated anyhow
- identifying studies that need to be merged, e.g. when an imaging study is cancelled / incomplete and has to be repeated / completed within a few days, leading to two DICOM studies that together make up a single logical timepoint
- classifying the remaining images as “native”, “contrast-enhanced” (incl. phase), “showing the complete liver”, “T1-weighted”, “DCE-MRI sequence”, …
- counting the number of complete “cases”, e.g. “I need a prior and a matching follow-up image”, “I need a native and a contrast-enhanced image”, “I need n different dynamic contrast enhanced images” Basically, one could describe the above as “putting images into the correct buckets”, and a related task would be to check how many cases are “complete”, in the sense that a specified number of buckets is “filled”.
There are probably countless attempts at supporting this workflow (some of which I am aware of), but this project is about checking what the Meta dashboard that comes with Kaapana already supports and could (/should) support in the future.
Having a dashboard summarizing a data collection in a meaningful way is a recurring theme also outside of kaapana. We would like to investigate to which degree the requirements coming with common use cases (such as AI annotation, cohort definition, AI model training, automatic quality assurance) are already met and if they’re not, how extensible the existing dashboard is. Furthermore, it would be interesting to assess whether such a dashboard can be shared with other projects (IDC, Grand-Challenge), and whether that really makes sense in practice. Related to Fast viewing and tagging of DICOM Images (as well as to previous PW endeavors around Chronicle and DICOMweb by Steve Pieper).
Objective
- Use the Meta Dashboard without kaapana, on data that is not in a PACS.
- Understand the limits of the current OpenSearch/Kibana stack, and whether it supports all intended use cases.
Approach and Plan
- Find out about the schema / information used by the Meta dashboard.
- Try to set up the Meta dashboard outside of kaapana.
- Feed OpenSearch with data from a dataset that is not in a PACS.
- Document results (code / schema / design / use cases).
Progress and Next Steps
- Hans has learned (mostly from Stefan) much about the current process / integration of the Meta dashboard in kaapana, and about its code location(s). Many things have been documented on this page to help others as well.
- Hans spent a lot of time reviewing Kaapana code and opened a pull request with a few refactoring steps (https://github.com/kaapana/kaapana/pull/13).
- Hans wrote a MeVisLab module “DICOMTree2JSON” that mimicks what dcm2json does and converts in-memory DICOM information into JSON. (The output has been verified to be “mostly identical” except for the pixel data which is not dumped. Other exceptions are integer “1\u0000” -> 1, for instance.)
- Kaapana’s dashboard defaults to documents on the series level (but the code would also support SOPInstances / single frames). Hans is using MeVisLab’s / SATORI’s image level, which can be both below or above the series level, depending on the import configuration (e.g., composing DCE-MRI volumes from multiple images). Of course, this needs to be taken into account when configuring the dashboard.
- Kibana nicely allows filtering on any level (patient / study / series / image properties), but the dashboard will only list the number of patients that contain an image matching a certain criterion, not the patients that contain only images matching a criterion. A query such as “give me all patients that have at least two timepoints with a T1 and a T2 weighted image” does not seem to be possible. There seem to be more complex aggregation options in OpenSearch, however, so it remains to be investigated if that could be implemented as well.
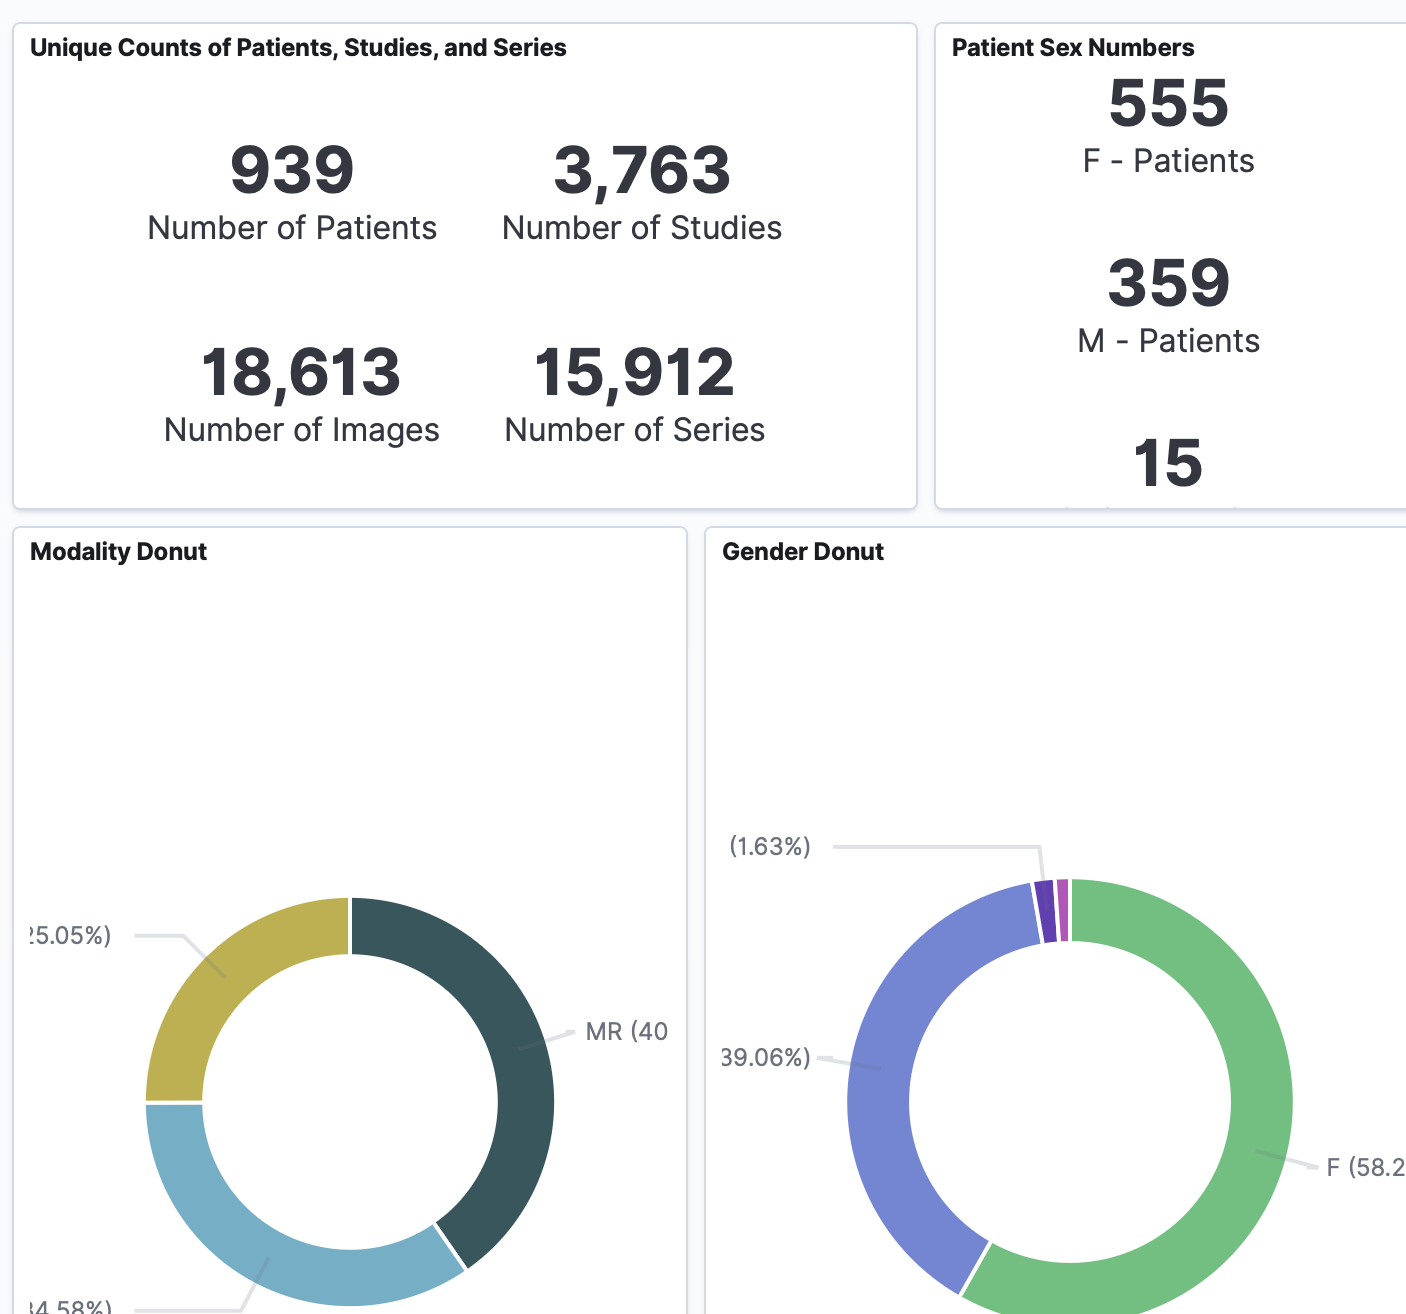
Illustrations
Screenshot of resulting meta dashboard with data ingested from a MeVisLab-based SATORI workspace:
Background and References
General information / pointers:
- There is a dag_service_extract_metadata.py which is responsible for the metadata extraction.
- That dag uses a LocalDcm2JsonOperator and LocalJson2MetaOperator which seem to be the most important classes to look at.
- LocalTaggingOperator could also be relevant / interesting? This operator manages a set (/list) of tags per document in the meta index (cf. attribute
dataset_tags_keyword). It is possible to add/remove tags, they can come from JSON files, and it is possible to read DICOM tags (e.g., ClinicalTrialProtocolID) into tags. - The cohort definition is implemented in kaapana/services/meta/os-dashboards/workflow-trigger (the name is no longer descriptive for legacy reasons) as a Kibana plugin that triggers a kaapana dag.
Reviewing LocalDcm2JsonOperator revealed the following functionality (not complete):
- calls dcmodify to remove pixel data tags
- calls dcm2json to produce a JSON file
- seems to work around dcm2json producing non-standard float representations (caveat:
cleanJsonDatawill have false positives / modify non-numeric tags as well) - uses a DICOM dictionary file (dicom_tag_dict.json) to convert tag IDs to names (
get_new_key) - the resulting JSON document will have keys such as
0008103E SeriesDescription_keyword(_keywordis the default suffix, but depending on the VR, there are other: DA ->_date, DT ->_datetime, TM -> time, DS/FL/FD/OD/OF ->_float, IS/SL/SS/UL/US ->_integer, SQ ->_object– the point of these suffixes is that OpenSearch is then configured to index the attributes according to their suffix) - RTSTRUCT and SEG files are treated specially and will have additional keys such as
rtstruct_organ_list_keyword - adds a
timestampkey based on acquisition/series/content/study/current date+time (using the first one available) - adds
timestamp_arrived_datetime,timestamp_arrived_date,timestamp_arrived_hour_integer - adds
00101010 PatientAge_integerbased on00100030 PatientBirthDate_dateor00101010 PatientAge_keyword - splits
00120020 ClinicalTrialProtocolID_keywordinto a list (under the same key)
Summary of steps I performed in order:
- Spun up https://hub.docker.com/r/opensearchproject/opensearch-dashboards with docker-compose (reduced the example .yml to one node)
- Used
INIT_OPENSEARCH=true kaapana/services/meta/meta-init/docker/files/init_meta.pyto create the OpenSearch index (I manually set use_ssl=True). If you remove the index (e.g., withhttp --verify=no DELETE https://admin:admin@localhost:9200/meta-index), you need to repeat this step. It does not have to be done before setting up the dashboard, though – the latter just defines a view into OS, so it is really independent. - Similarly, ran the script with
INIT_DASHBOARDS=true DASHBOARDS_URL=http://admin:admin@localhost:5601 DASHBOARDS_JSON=kaapana/services/meta/meta-init/meta-init-chart/files/dashboard_import.jsonto upload the default dashboard config (commenting out the call toset_ohif_template()) - Exported dcm2json-like information from MeVisLab, with the new module I developed for that purpose
- Ran a small hacked together supplement of the LocalDcm2JsonOperator on my exported files (see the above summary of its functionality).
- This already allows to play with the dashboard. What’s not working yet is the cohort definition.