 NA-MIC Project Weeks
Back to Projects List
Clinical trajectory visualization based on edema quantification from chest x-ray
Key Investigators
- Ruizhi Liao (MIT)
- Steve Pieper (ISOMICS)
- Polina Golland (MIT)
Project Description
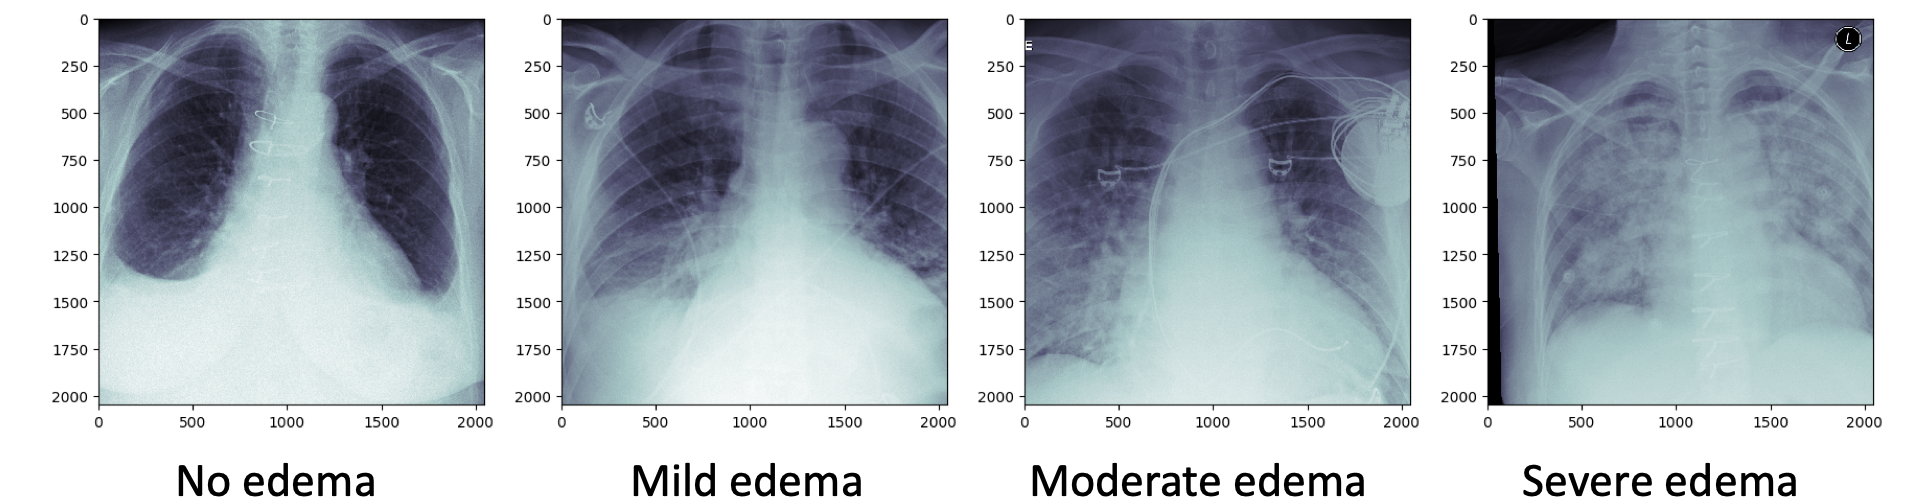
We have developed machine learning algorithms to automatically quantify the severity of pulmonary edema from chest x-rays on a continuous scale. The resulting assessment can be used for visualization of heart failure patient recovery trajectories in prior episodes of heart failure to support physicians with a data-driven approach to treating patients. We would like to investigate different ways of visualizing the clinical tracjectories that can inform physicians how different patients responded to different medications/treatment plans.
ML algorithms for quantifying pulmonary edema in chest x-ray: https://www.csail.mit.edu/research/chest-x-ray-analysis
Example x-ray images:
Approach
- Look into Crossfilter: http://square.github.io/crossfilter/
- Look into Vega-lite: https://vega.github.io/vega-lite/
- Look into i2b2: https://www.i2b2.org/
- …
Progress
- Collected visualization ideas and option from several investigators
- Developed a prototyping plan
Next steps
- Implement some visualization ideas using a few patient datasets
- Iterate with clinical colleagues on best implementation options
Background and References
ML algorithms for quantifying pulmonary edema in chest x-ray: https://www.csail.mit.edu/research/chest-x-ray-analysis